
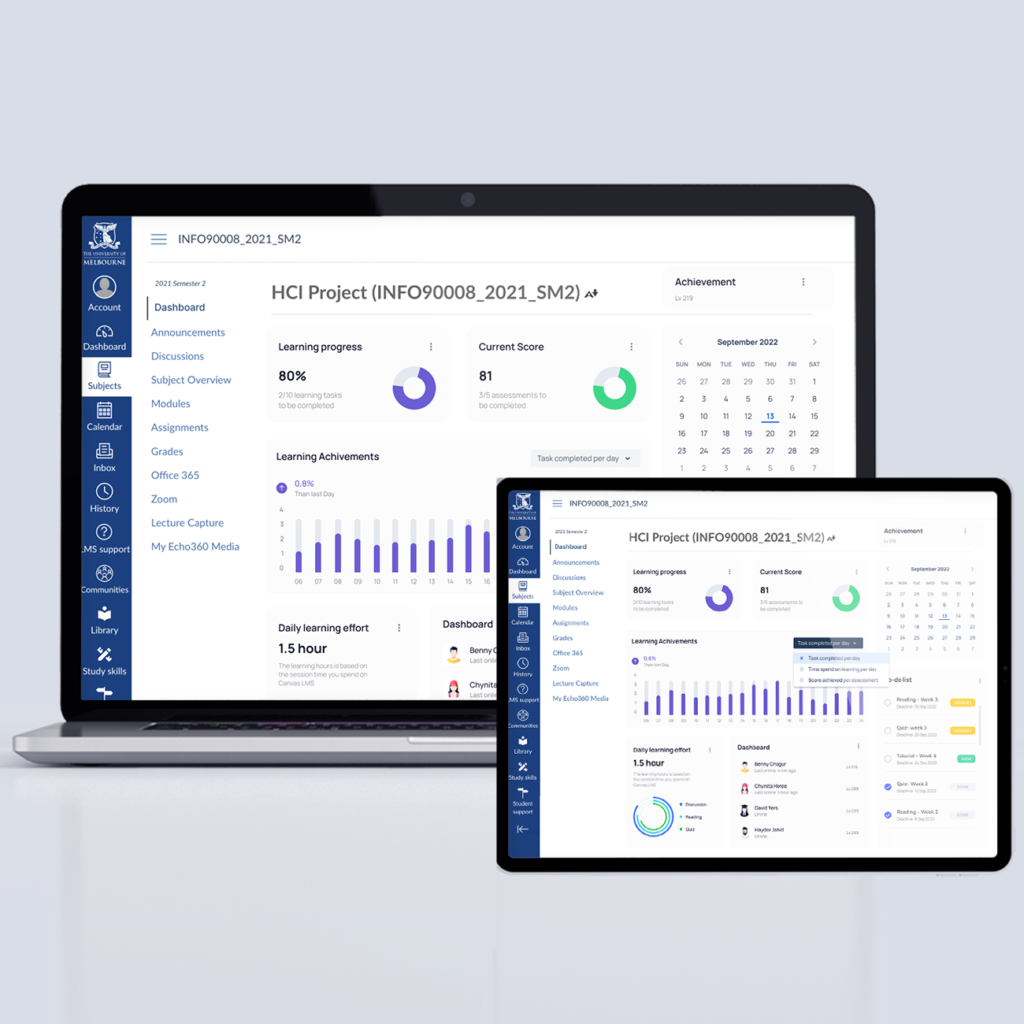
Canvas LMS Goal Oriented Dashboard
This study designed a dashboard that allows students to set and track personalised goals including performance goals that are related to the final results students expect to attain and learning goals related to the study modules and learning tasks students aim to accomplish. Quantitative and qualitative methods are used to evaluate how students would like to prioritize different types of goals under the visualization scenarios of self-regulated learning, learning rewards, and peer learning.
Publication on ASCILITE :
https://publications.ascilite.org/index.php/APUB/article/view/168
Type
Unimelb HCI Final Researcher Project
My role
Product Designer/Researcher
time
2021. 6 - 2021. 11
Team
Supervisor:
Dr Eduardo Araujo Oliveira
Dr Paula Galvao De Barba
Project Background & Literature Review
Goal theory is defined as establishing a clear and usable target for learning (Yusuff & Kazeem 2018). Students can prioritize different goals adaptively. Learning goals are seen as a task-centric orientation with an intrinsic focus, while performance goals are seen as ego involving and more relevant in the scenario of doing better than other students (Moeller et al., 2012). Students with different characterizes may put different types of goals into priority. This goal-oriented dashboard allows students to perceive different types of goals on the dashboard in three main use cases: online self-supervised learning, virtual rewards for online learning, and online peer learning.
Online Self-Regulated Learning
Online Learning Achievement And Rewards
Achievement-based rewards are considered as a major performance goal that can motivate students (Abdul Razak, Rafiza, See & Yee Chen, 2010). Meanwhile, self-evaluation can be an intrinsic motivation while visualizing multiple learning achievements. (Deci, Koestner, & Ryan, 1999).
Online Peer Learning
There’re many factors that can influence the role of competitions in educations settings, including gender and disciplines (Seiffori & Zohreh, 2014). Meanwhile, it’s important to not depreciate students who are falling behind their peers during the comparison (Verhoeff & Tom, 1997).
Methodology
This study is going to follow the human-centered design method, which includes the IDEO process of empathizing, defining, ideate, prototyping, and user test in iterative cycles (Joseph, 2014). This approach allows rapid prototyping and immediate evaluation to understand users’ decision-making process and expectations under different goal-oriented visualization scenarios.

1st Iteration
Quantitative Research
Paper prototypes of the widgets are used to understand how students would like to visualize and manage different goals under different scenarios. Quantitative evaluation data is collected through a survey with a combination of card sorting activity, multiple choices questions, and an open-end question.

2nd Iteration
Qualitative Research
Responding to the evaluation result from the first iteration, we created a wireframe according to the widgets prioritization ranking. Qualitative research methods such as Think Aloud Protocol and Interviews are conducted to collect requirements and usability problems of the prototype (Sutcliffe & Alistair, 2016).
3rd Iteration
Final Prototype
Responding to the evaluation result and creating final prototype and presenting a universal design approach that can reflect how online students would like to visualise different types of goals while delivering a simple user experience.
Ideation
Based on the literature review, we conducted a card sorting activity to brainstorm and sort all types of goals that students would like to visualize and put them into three categories:
- Performance goals (e.g. achieve H1 in the subject, rank in the top 20% of the class)
- Learning goals (e.g. complete a study module, learn a new algorithm)
- Effort goals (e.g., spend 10 hours per week on study)
Possible visualization ideas for the three use cases were also created so we can further evaluate the ideas during research.
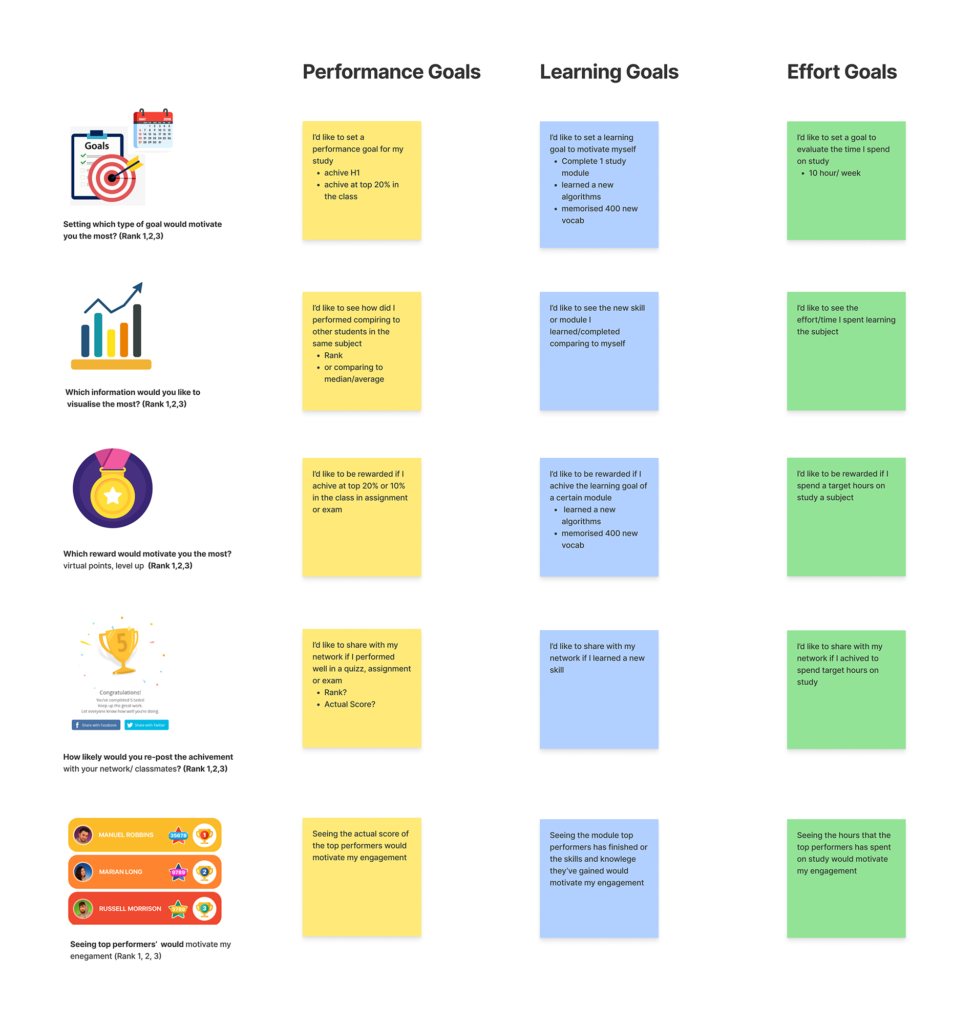
Survey Design And Paper Prototype
The questionnaire is built with Qualtrics powered by card sorting method which allows participants to drag and drop the prototypes for each widget into the 3 different categories: ‘Must have’, ‘Nice to have’, and ‘No need’. This survey helped us find out the feature prioritisation suggested by users.

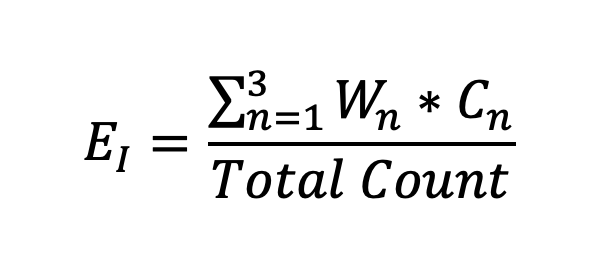
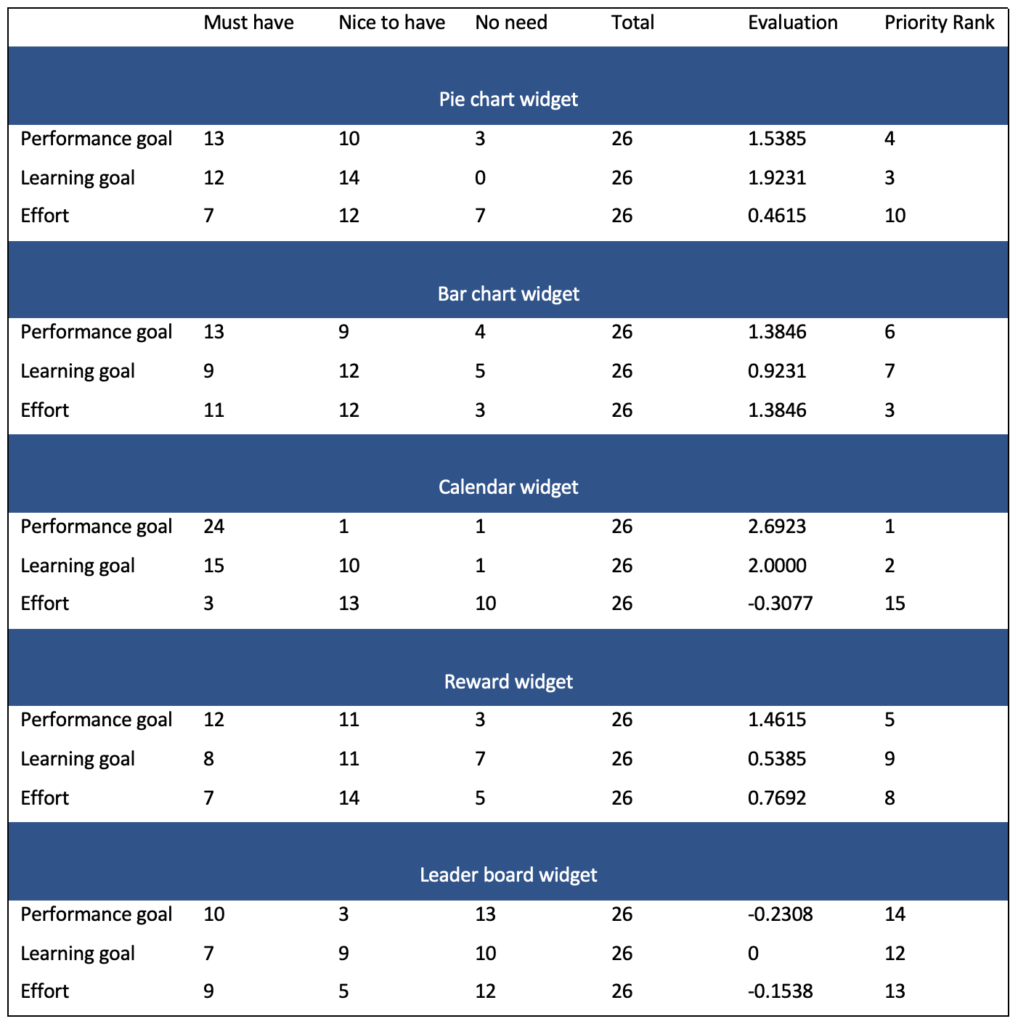
Data Analysis - Widgets Priority
There are 26 students’ respond to the survey with 23 of them in the age range of 18-32 and 3 of them over 32 years old.
The method used to analyse the quantitative research data is adapted from the Majority Voting Goal Based(MVGB) technique for Requirement Prioritization (R. M. Liaqat,2016), A-weighted value is given to each category: ‘Must have’ weighted for 3 point, ‘Nice to have’ weighted for 1 point, ‘No need’ weighted for -3: W= {3, 1, -3}, and the evaluation value is the partial sum of the count for each category C= {C1,C2,C3} * W= {3, 1, -3} and divided by total count:
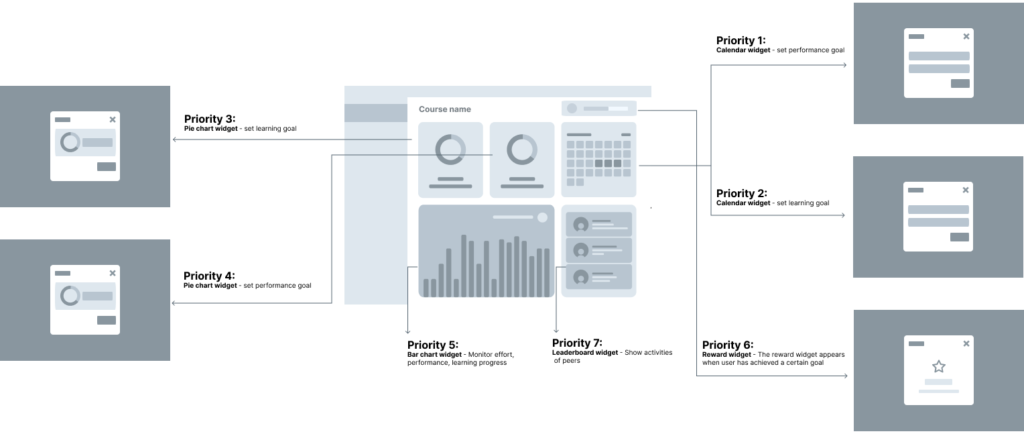
User Flow And System Requirements
The wireframes are based on the widget prioritization suggested by students, the label on each widget indicates the priority ranks from the evaluation result in section 4.
Set A Goal In The Calendar Widget
Performance goal deadlines (quizzes and assignments) are auto-filled and sync with the Canvas LMS calendar, appearing as Visualization 1. Once users upload assignments or complete quizzes, tasks automatically mark as done. To set learning goals, click ‘Add’ on the calendar widget. A pop-up, Visualization 1B, allows users to select a deadline date and set their chosen learning tasks from a dropdown.
Set A Goal In The Pie Chart View
Share Achievement On Leaderboard
Based on the evaluation, the leaderboard is optional for students to share achievements. Virtual points, as an achievement level in Visualizations 8/9, are kept for ongoing testing. They’re calculated by adding the current performance result to the learning progress, multiplied by 100%.
User Testing
As Seiffori and Zohreh (2014) mentioned that gender and discipline could influence how students view competition in the educational setting, we controlled the variables of the participants’ gender, learning discipline, and keen to find out the student with better performance results would be more motivated by peer’s data. Both female participants are pursuing degrees in information systems-related fields; however, they are at different life stages with different learning and performance goals.
We recorded the video screenshot of the user tests (Appendix 2), and the effectiveness of the user interface is evaluated by the total time that participants consumed to complete the user flow on the interactive prototype with the think-aloud protocol.


Participate A
Participant A claimed that she wouldn’t share her current performance and learning progress on the leaderboard. She thought the reward is a good motivation for her but encouraging competition could disrupt the whole university experience and increase peer pressure.
Quote A: ‘Congratulations to myself!” (smiling) ‘I wouldn’t share my achievement, it’s just not my personality’
Participate B
Participant B mentioned that she would like to share her performance if she performs at the top. For now, she just wants to peek at how others are doing but is not interested(able) to participate.
Quote B: ‘It’s important for me to know others’ learning progress during isolated learning.’
Final Prototype
The objective of the final design is to solve the usability issues mentioned by participants in section 5.3.2 and present a universal design solution that can accommodate users from different cultures, ages, gender, personality, and disciplines.
Several enhancements were made based on the feedback to ensure a more friendly and efficient user experience.
Pie Chart Widget
Calendar Widget
The ‘Mark as Done’ function was brought to the task list in the calendar widget as both participants reflected that this would simplify the interaction and help with managing the tasks better. To avoid jumping across calendars, the time and link to the live lectures will be prefilled on the dashboard calendar directly as well.
Leaderboard Widget
To improve the feeling of engagement, we show a virtual level by combining the current performance result + the learning progress * 100%., it’s an optional feature that users can voluntarily share the achievement with personalized profile images and nicknames. Students have an option to hide the widget.